Checking Crime Before You Buy a Home in Toronto: A Complete Guide
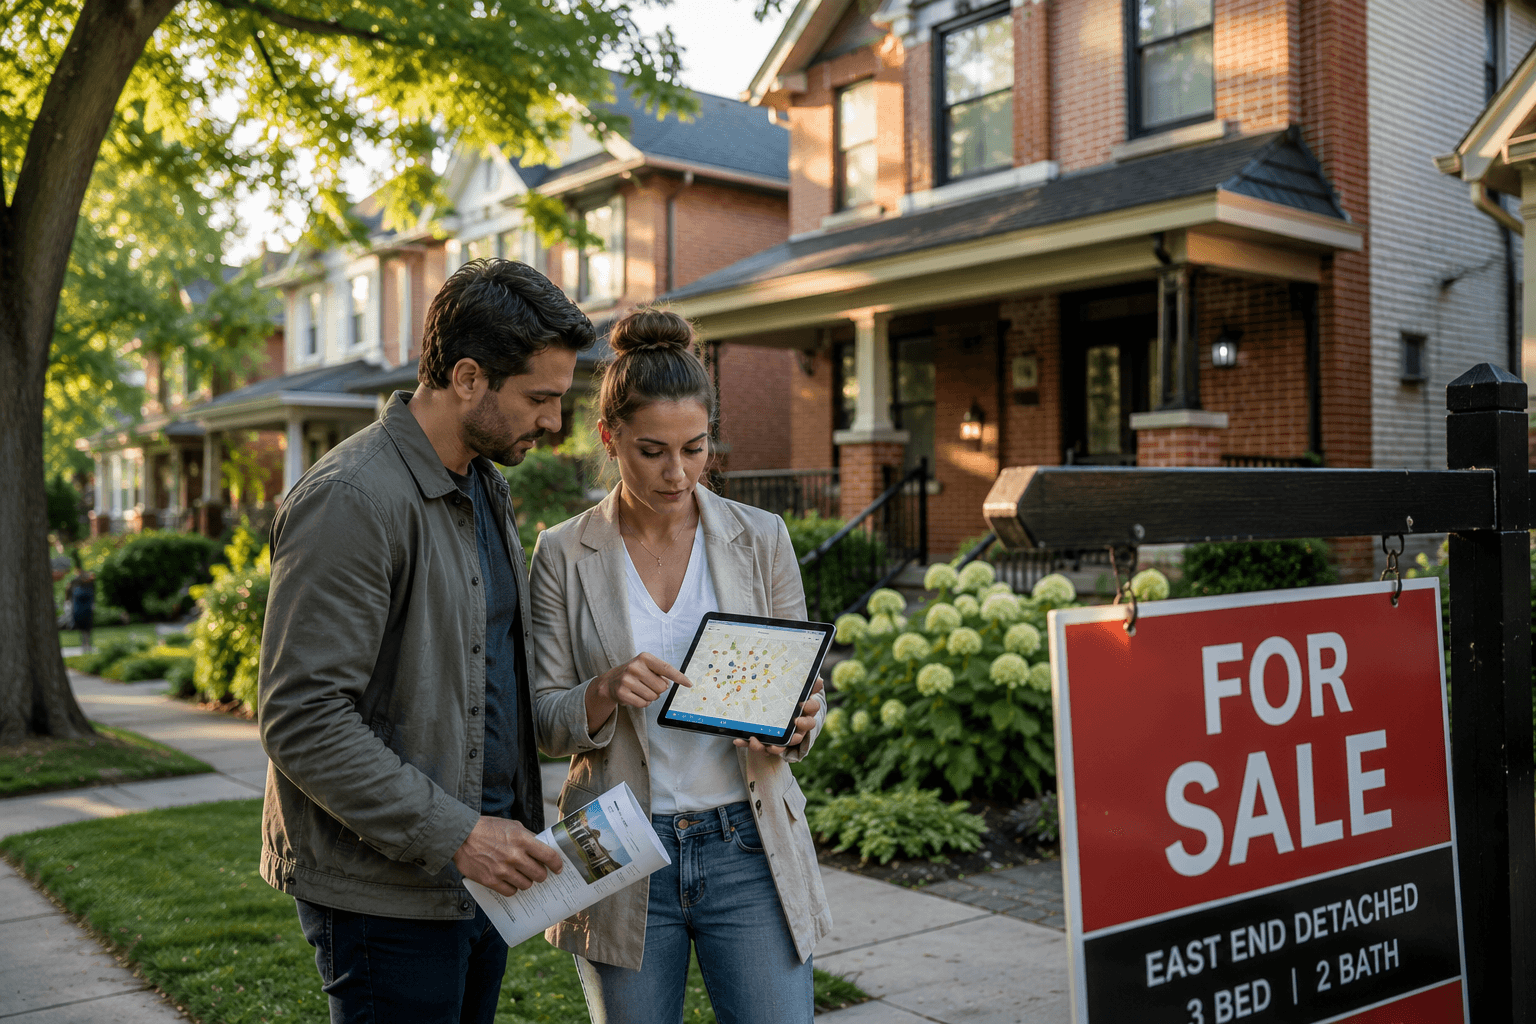
A Toronto home is likely the largest purchase you will ever make. The listing shows granite counters and walk score; it rarely shows how many break-and-enters were reported within 500 metres last year, whether auto theft on the street is rising, or how this block compares to the next one over.
That information exists. Toronto Police publish it openly. Most buyers never look — until after they move in and notice the security cameras on every neighbour's porch.
Here is a practical guide to checking crime before you buy, using the same official data Safety Score pulls every day.
Why crime research belongs in your due diligence
Standard home-buying checks cover structure, zoning, and flood plains. Crime is rarely in the binder — yet it affects insurance, resale, peace of mind, and sometimes monthly costs (security systems, parking habits, whether teenagers walk home alone at night).
You are not looking for zero crime. That does not exist in a city of three million. You are looking for:
- A clear picture of what happens nearby (violent vs property crime)
- Whether the trend is getting better or worse over years, not weeks
- How this address compares to alternatives on your shortlist
- Red flags worth asking the seller or your lawyer about
None of this replaces a home inspection. It complements it.
Step 1: Search the exact address
Start at the Toronto crime map and type the full property address — not just the neighbourhood name.
You get a pin on the property, a Safety Score for the address, street, and official neighbourhood, a map of reported major incidents within your chosen radius, and a filterable table with dates, categories, and distances.
Run the search for every finalist on your shortlist. Two homes ten minutes apart can sit in different statistical pockets, especially near neighbourhood borders.
Step 2: Understand the three scores
Every address search returns three related numbers:
| Score | What it measures |
|---|---|
| Property score | Blends the immediate street (60%) with the surrounding neighbourhood (40%) |
| Street score | Incidents within your radius, weighted by severity |
| Neighbourhood score | Official TPS border, from annual rates per 100,000 since 2014 |
For buying, prioritize property score and street score at 250–500 m. You will live on this block, not across the entire statistical area.
Full methodology: how Safety Scores are calculated.
Step 3: Read the trend, not just today's number
The year-by-year chart on the explore page shows whether reported crime near this address has been rising since 2014 or improving.
Watch for sustained decline (five or more years of improvement), sharp one-year spikes (often auto theft or break-and-enter waves — Toronto's citywide auto theft peak hit many pockets in 2023 before easing in 2025), and flat lines near 70 (genuinely typical).
A home in a neighbourhood that scored 85 in 2019 and 62 in 2023 tells a different story than one steady at 75 — even if both show 72 today.
Step 4: Filter the incident table
Buyers usually care most about these categories:
| Category | Why it matters when buying |
|---|---|
| Break and Enter | Home security, insurance, neighbour camera culture |
| Auto Theft | Driveway and garage risk; relay attacks on key fobs |
| Theft From Motor Vehicle | Street parking, overnight guests |
| Assault / Robbery | Walking at night, kids' independence |
| Shooting / Homicide | Rare but high-impact; check context and trend |
Use the category filter on the explore page. Count the last 12 months at 250 m for a conservative block-level read, and 500 m for a wider pocket. If 250 m looks quiet but 500 m is busy, you are on the edge of a hotspot — walk the street in daylight to see what sits between you and the activity.
Step 5: Open the full neighbourhood page
The neighbourhood page for the property's district adds border-to-border stats, published crime rates per 100,000 by category, multi-year rate charts, and FAQ with cited data.
This helps when the house sits in a large or uneven neighbourhood — north Leaside vs south, or the edge of Forest Hill South near a busier arterial.
Compare finalists: Forest Hill South (Safety Score 91) vs Oakwood Village (92) shows similar headline scores with different property-vs-violent mixes once you filter the incident table.
Step 6: Pick the right time window
| Window | Best use when buying |
|---|---|
| 365 days | Default — full seasonal cycle |
| 90 days | "Right now" snapshot; can miss quieter winters |
| 30 days | Too noisy for a purchase decision |
| 7 days | Ignore for buying |
Buy on the year trend and the multi-year chart, not a single busy month.
Questions to bring to the viewing
For the seller or listing agent:
- Have there been break-ins on this block in the last two years? (You already know from data — listen for honesty.)
- Is there a private security patrol or neighbourhood watch on this street?
- Any insurance claims related to theft or property damage?
On the walk-through: ground-floor window exposure, lane access, garage visibility, street lighting, driveway sightlines from the road.
For condos: search the building address at 250 m, then compare to the wider neighbourhood. Ask property management about garage or lobby incidents.
Common buyer mistakes
Trusting the neighbourhood name alone — always search the pin. Dismissing property crime while fixating on shootings; in many Toronto pockets including affluent midtown streets, break-and-enter and auto theft drive security spending more than violent crime. Ignoring the 2023–2024 auto theft wave even when 2025 improved — cameras and film often stay for years. One search and done — re-run before closing and set a free email alert during a long closing period.
After you buy
A daily or weekly digest for your address emails new reports within your radius. Most weeks are quiet; the alert matters when something new posts.
The bottom line
Buying in Toronto without checking crime data is like skipping the inspection because the photos looked fine. The data is free, official, and takes ten minutes per address.
Search every finalist. Read the 12-month table. Study the trend chart back to 2014. Filter for break-and-enter and auto theft if you are buying a house with a driveway. Compare scores across your shortlist.
You will still buy in a city with crime — everyone does. The goal is to buy with eyes open, on a block whose reality you understand before the lawyer sends the closing documents.
Data: Toronto Police Service open data via Safety Score. Not a substitute for legal or insurance advice. Privacy policy.