Auto Theft in Toronto: How to Check Your Street Before It Happens
Ask Torontonians which crime worries them most and auto theft still tops the list. Insurance costs, viral security-camera footage, and stories of SUVs disappearing from driveways in under a minute have made it feel city-wide. The useful question is narrower: how many vehicles were reported stolen within a few hundred metres of where you park — and is that number rising or falling?
Toronto Police Service open data lets you answer that in seconds. The picture at city scale and at street scale are not the same story.
The city-wide wave — and the pullback
Across Toronto's 158 official neighbourhoods, the average published auto theft rate per 100,000 residents tells a clear arc. Rates climbed steadily through the early 2020s, spiked in 2023, then eased in 2024 and 2025:
| Year | Average auto theft rate (per 100,000, city neighbourhoods) |
|---|---|
| 2019 | 175 |
| 2021 | 220 |
| 2022 | 319 |
| 2023 | 386 |
| 2024 | 285 |
| 2025 | 217 |
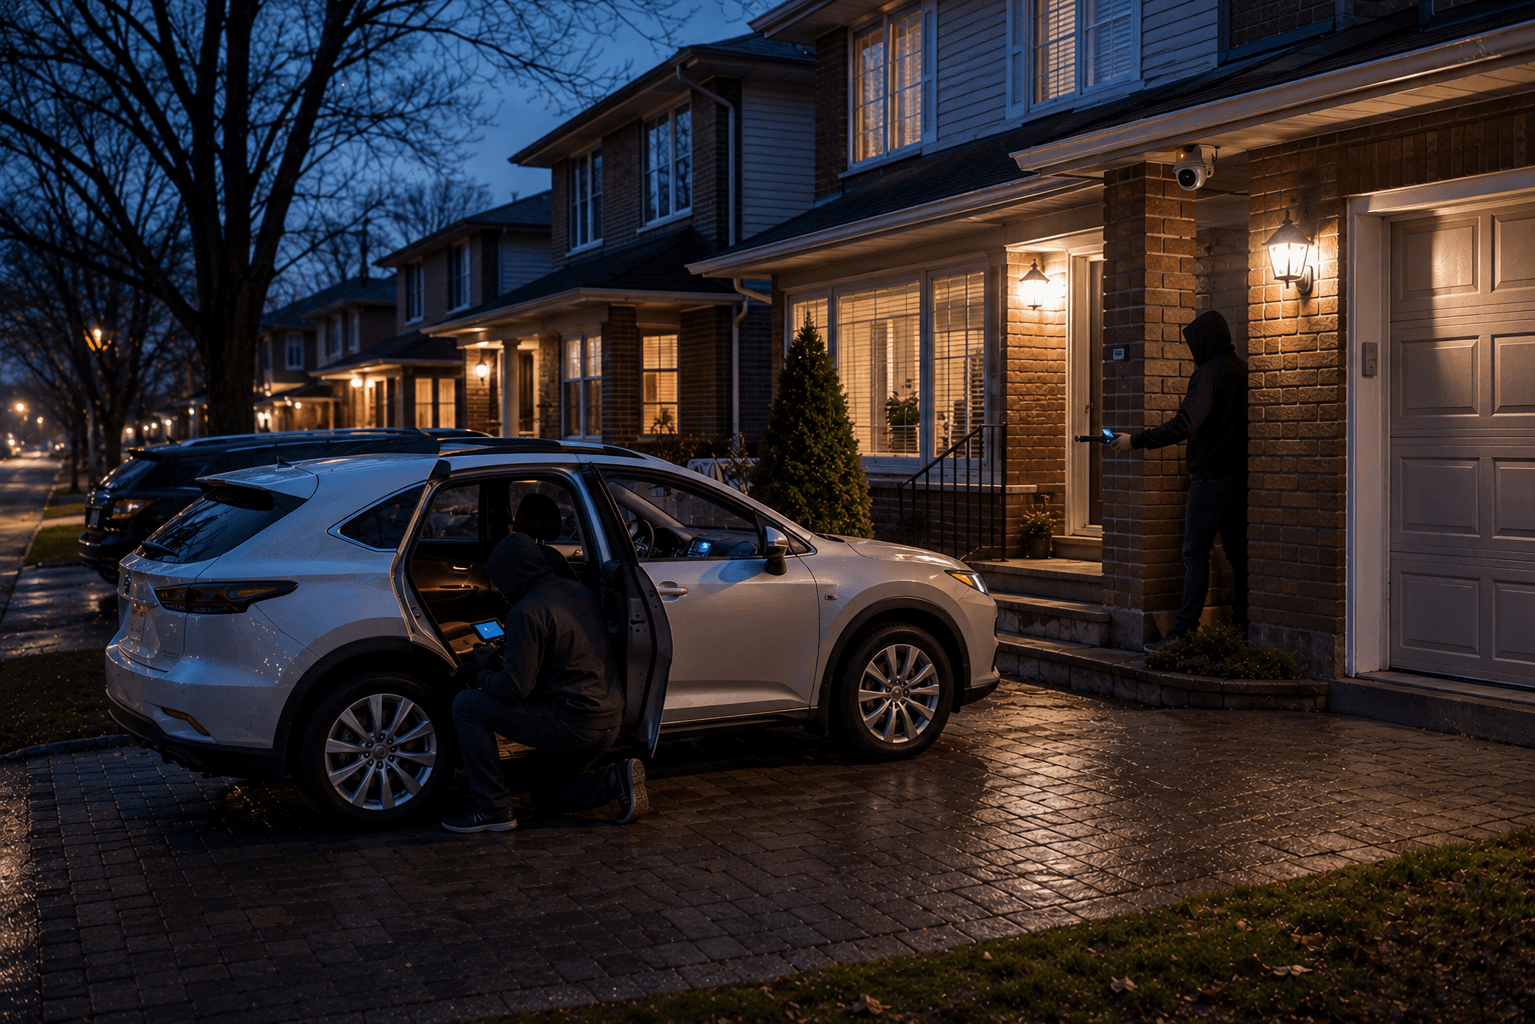
That 2023 peak aligns with what police and insurers were publicly describing at the time: organized groups targeting keyless-entry SUVs and trucks, often using relay tools to capture fob signals from inside homes, then reprogramming vehicles through the on-board diagnostics port. Border enforcement, dedicated police projects, and insurer pressure on immobilizers have been credited with a broader pullback across Ontario since 2024 — but reported theft remains well above where it stood a decade ago.
The live year-to-date feed on Safety Score — refreshed from the same Toronto Police open data as the map — shows the scale still moving in real time. Through early July 2026, the city has already logged thousands of reported auto thefts and thefts from motor vehicles combined:
Headlines about a "crisis" and headlines about "improvement" can both be true. The trend is down from the worst year. It is not back to normal.
Auto theft is intensely local
City averages hide enormous neighbourhood spread. In 2025, published rates per 100,000 residents ranged from fewer than 20 in parts of downtown and the waterfront to more than 1,300 in northwest pockets near Highway 401 and the airport employment lands.
| Neighbourhood | Safety Score | Auto theft rate (2025) | Auto theft rate (2023) |
|---|---|---|---|
| West Humber-Clairville | 36 | 1,321 | 2,283 |
| Etobicoke City Centre | 53 | 602 | 1,044 |
| Milliken | 58 | 608 | 1,211 |
| Scarborough Village | 53 | 278 | 261 |
| Rosedale-Moore Park | 68 | 200 | 657 |
| Forest Hill South | 91 | 106 | 790 |
| Lawrence Park South | 95 | 177 | 762 |
| South Eglinton-Davisville | 97 | 59 | 74 |
| Bay-Cloverhill | 82 | 17 | 74 |
Two takeaways matter for homeowners.
First, the highest rates are not random. They cluster near highways, large parking fields, and areas where newer trucks and SUVs sit in driveways or apartment lots overnight. West Humber-Clairville and Etobicoke City Centre sit in that pattern year after year.
Second, affluent midtown streets are not immune — but many saw sharp drops after the 2023 spike. Forest Hill South's published auto theft rate fell from roughly 790 per 100,000 in 2023 to about 106 in 2025. Lawrence Park South, Bedford Park-Nortown, and Kingsway South show similar retreats. That does not mean driveways are safe; it means the worst year of the wave was concentrated in time, and local anxiety often lags the statistics.
That is why a neighbourhood average — or a viral story from another part of the city — can mislead. The question that protects you is hyperlocal.
How to check your street
Search your Toronto address on the crime map, then filter the incident table to auto theft. You will see every reported theft within your chosen radius over the last 12 months, each with date and distance from your door, plus a year-by-year chart back to 2014 showing whether your block is improving or sliding backward.
Practical workflow:
- Start at 500 m radius — wide enough to capture your block and the next street over, tight enough to stay relevant.
- Filter to Auto Theft and scan the 12-month count and trend chart.
- Open your neighbourhood page from the map (for example West Humber-Clairville or Rosedale-Moore Park) to compare border-to-border rates with your address-level search.
- Repeat for any address you are considering — a rental, a parent's home, a new purchase.
If you want updates without checking back, set up a free email alert for your address. Daily or weekly digests include new auto theft reports within your radius, and you can opt in to Safety Score change notifications.
What actually helps
No accessory makes a vehicle impossible to steal. Professional crews target the easiest car on the easiest block. The goal is to add minutes and visibility — enough that thieves move to a softer target.
Police services, insurers, and vehicle-security specialists broadly converge on a short list:
- Block relay attacks. Keep key fobs in a Faraday pouch, away from the front door and garage. Most modern thefts start with capturing or relaying the fob signal overnight.
- Protect the OBD port. A lock or relocation kit slows reprogramming attacks that start once a thief is inside the cabin.
- Use visible mechanical deterrents. Steering wheel locks are back because they signal effort on a quick scan of a street.
- Park defensively. Garage beats driveway; driveway beats curb. If you have two vehicles, block the more desirable one in.
- Layer tracking. A concealed secondary tracker survives when crews find and discard the obvious unit.
Match spending to data. A street with zero auto theft reports in ten years may need only good habits. A cluster within 500 m — especially if this year is tracking last year — strengthens the case for a pouch, OBD lock, and tracker.
The bottom line
Toronto's auto-theft story in 2026 is not one number. The city-wide average rate fell from a 2023 peak of 386 per 100,000 to 217 in 2025, yet northwest neighbourhoods still report rates above 600 — and year-to-date open data shows thousands of fresh auto theft and theft-from-vehicle reports across the city.
Before you buy hardware or lose sleep over a headline, check your address on the crime map. Ten seconds of search beats a city-wide statistic every time.
Data source: Toronto Police Service open data (Major Crime Indicators and year-to-date feed), neighbourhood rates through 2025, year-to-date counts through early July 2026. Rates are per 100,000 residents by official neighbourhood boundary. See our methodology. Safety Score is independent editorial analysis, not affiliated with Toronto Police.