
Toronto Shootings and Violent Crime by Neighbourhood: 2025–2026 Trends
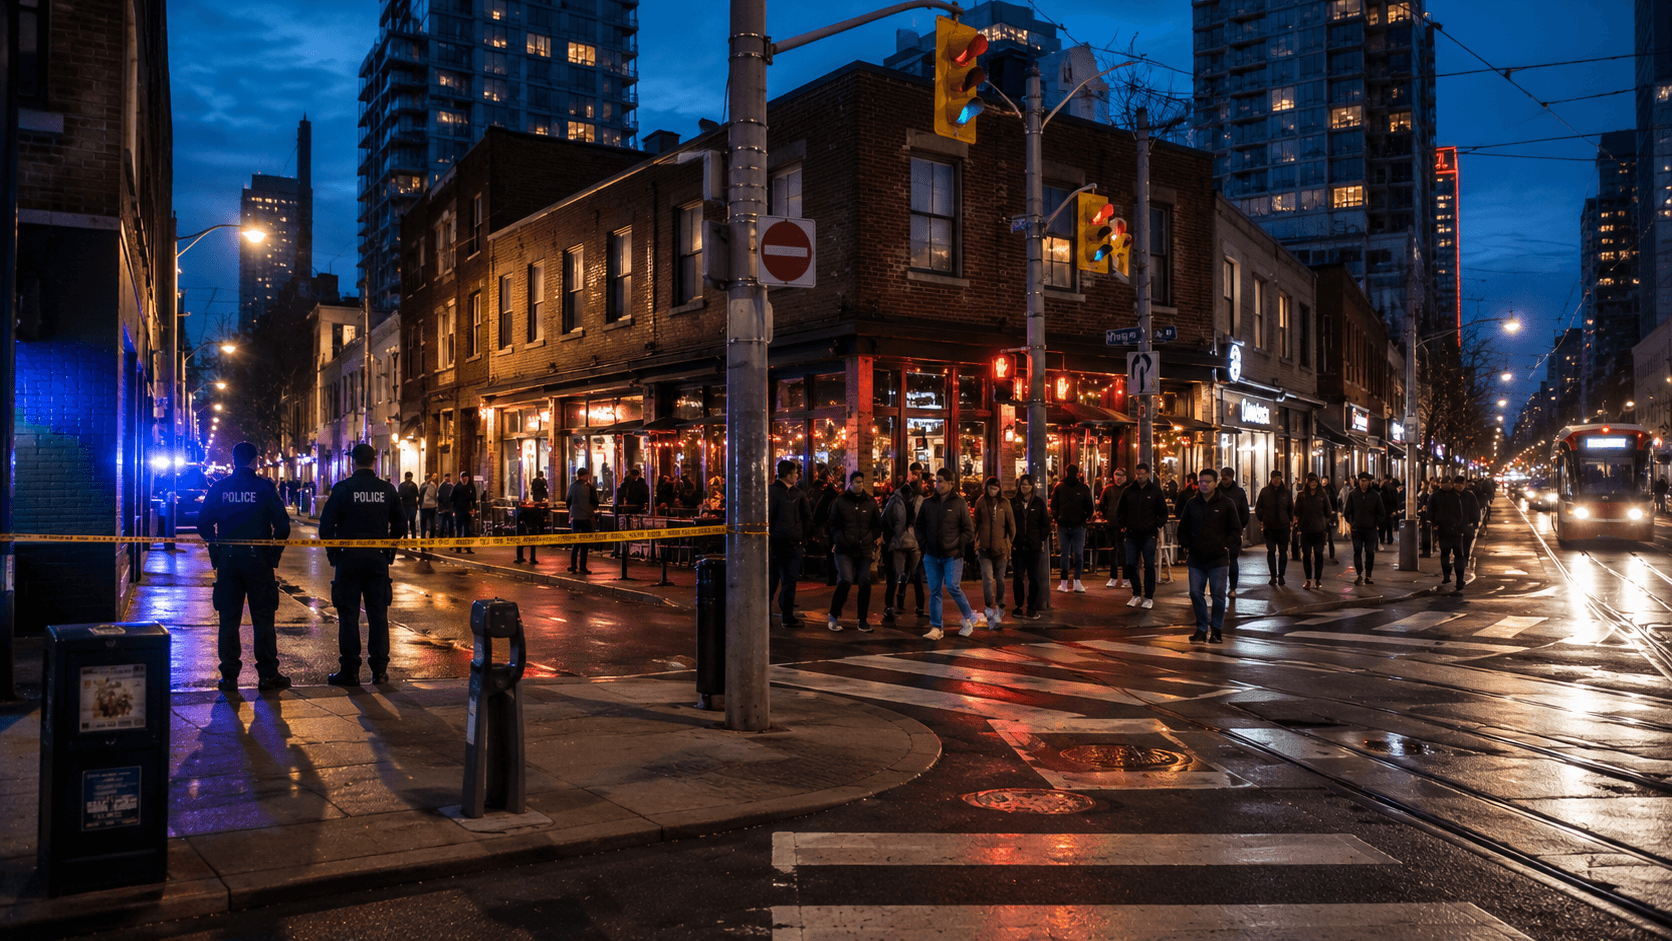
Toronto's crime conversation in 2025 and 2026 has been dominated by home invasions, break-and-enters, and auto theft in affluent neighbourhoods — Forest Hill, Rosedale, Lawrence Park. That story is real in the police data.
It is also only half the map.
Violent crime — assaults, robberies, shootings, and homicides — follows a different geography. Downtown entertainment districts, some east- and north-west pockets, and select suburban neighbourhoods carry rates that dwarf quiet residential midtown on violence even when property crime is tame.
This article maps where violent crime concentrates using published 2025 neighbourhood rates from Toronto Police open data, how that picture differs from property crime, and what buyers and residents should take from it.
Two crime layers, two maps
Property crime — break-and-enter, auto theft, theft from vehicles — spiked citywide in 2022–2023. Organized groups targeted luxury vehicles in driveways; affluent areas felt it disproportionately in headlines even when violent rates stayed moderate.
Violent crime — assault, robbery, shooting, homicide — concentrates in dense commercial zones, transit hubs, nightlife corridors, and specific residential pockets. It shapes how people feel walking home at 2 a.m. near King West more than it drives private security cars on Forest Hill blocks.
Safety Score weights violent categories more heavily in the headline score — a shooting hurts more than a bike theft. Filter to violent offences alone and the ranking reshuffles dramatically.
How we measure violent crime here
We sum Toronto Police published rates per 100,000 residents for assault, robbery, shooting, and homicide in 2025. Rates are population-adjusted inside each official neighbourhood border.
Raw incident counts from the live feed fluctuate daily; annual rates are the fairer year-level comparison. For recent activity, use the 30- and 90-day tables on each neighbourhood page.
Highest violent-crime neighbourhoods (2025)
| Neighbourhood | Assault | Robbery | Shooting | Homicide | Safety Score |
|---|---|---|---|---|---|
| Mimico-Queensway | 4,209 | 42 | 0 | 4 | 37 |
| Yonge-Bay Corridor | 3,361 | 300 | 12 | 12 | 16 |
| Downtown Yonge East | 2,361 | 143 | 12 | 0 | 49 |
| Moss Park | 2,227 | 167 | 3 | 3 | 44 |
| Kensington-Chinatown | 2,017 | 193 | 22 | 0 | 42 |
| University | 1,741 | 134 | 0 | 12 | 26 |
| Kennedy Park | 1,521 | 122 | 16 | 5 | 44 |
| Danforth | 1,562 | 68 | 0 | 10 | 41 |
Rates per 100,000 residents, Toronto Police neighbourhood crime rates 2025.
Yonge-Bay Corridor sits at the bottom of Toronto's overall Safety Score (16) with assault and robbery rates in the thousands — characteristic of central entertainment and tourist districts, not suburban family streets.
Mimico-Queensway ranks first on combined violence despite a higher overall score than Yonge-Bay — driven by an extremely high assault rate. Check the neighbourhood page for how much occurs in commercial strips vs residential blocks.
Where shootings concentrate
Shooting rates are low citywide compared to assaults, but fear per incident is high. Highest published shooting rates per 100,000 in 2025:
| Neighbourhood | Shooting rate | Safety Score |
|---|---|---|
| Black Creek | 34 | 59 |
| Wexford/Maryvale | 32 | 52 |
| Humber Summit | 31 | 45 |
| Yorkdale-Glen Park | 28 | 36 |
| Malvern West | 27 | 64 |
| West Humber-Clairville | 27 | 36 |
| Kensington-Chinatown | 22 | 42 |
| Glenfield-Jane Heights | 25 | 60 |
Several are not the neighbourhoods named in home-invasion coverage — underscoring why filtering by category matters when you research an address.
The affluent-neighbourhood contrast
| Neighbourhood | Violent sum | Break-and-enter | Safety Score |
|---|---|---|---|
| Forest Hill South | 270 | 327 | 91 |
| Forest Hill North | 419 | 159 | 97 |
| Rosedale-Moore Park | 1,167 | 456 | 68 |
| Bridle Path-Sunnybrook-York Mills | 274 | 403 | 78 |
Forest Hill South — cameras, security film, overnight patrol cars — has low violent rates and a Safety Score of 91, but elevated break-and-enter compared to the city median. Fear there is property-driven.
Rosedale-Moore Park shows how a wealthy area can sit below average overall (68) with break-and-enter above 450 per 100,000 while violent rates stay far below downtown cores.
If you read only property-crime headlines, you might miss that Yorkdale-Glen Park or Kensington-Chinatown face entirely different risk profiles.
Citywide direction of travel
Police and industry reporting describe a property-and-vehicle crime wave that peaked around 2023 before easing in many pockets through 2025, with organized theft still active at the borders. That trend is not the same as a citywide doubling of shootings. Violent patterns move more slowly in annual rate data.
When researching, always ask: is the risk I care about violent or property? The answer changes which neighbourhoods and which streets matter.
How to research violent crime on Safety Score
- Open any neighbourhood page and review assault, robbery, shooting, and homicide rate lines separately.
- Search a specific address on the crime map; filter the table to violent categories.
- Toggle 365 days for a full year near the property.
- Compare finalists — overall score and violent mix together.
- Set a free email alert for new reports nearby.
Read the methodology for how severity weights shape the headline Safety Score vs category filters.
The bottom line
Toronto violent crime in 2025–2026 is not evenly distributed and not the same story as the midtown property-crime wave.
Highest violent rates cluster in downtown corridors, Kensington-Chinatown, Moss Park, and pockets of Etobicoke and Scarborough including Mimico-Queensway and West Hill. Highest shooting rates land in a different set — Black Creek, Wexford/Maryvale, Humber Summit, Yorkdale-Glen Park. Affluent midtown shows low violence and elevated property crime.
Start with the right question and the right filter. The city publishes enough data to answer both — as long as you separate violent from property and look at the specific address, not the borough reputation.
Explore the full neighbourhood map or jump to any area in the tables above.
Source: Toronto Police Service neighbourhood crime rates (2025) and year-to-date Major Crime Indicators via Safety Score. See about our data. Not affiliated with Toronto Police.