
Toronto's Safest and Least Safe Neighbourhoods in 2026 (By the Numbers)
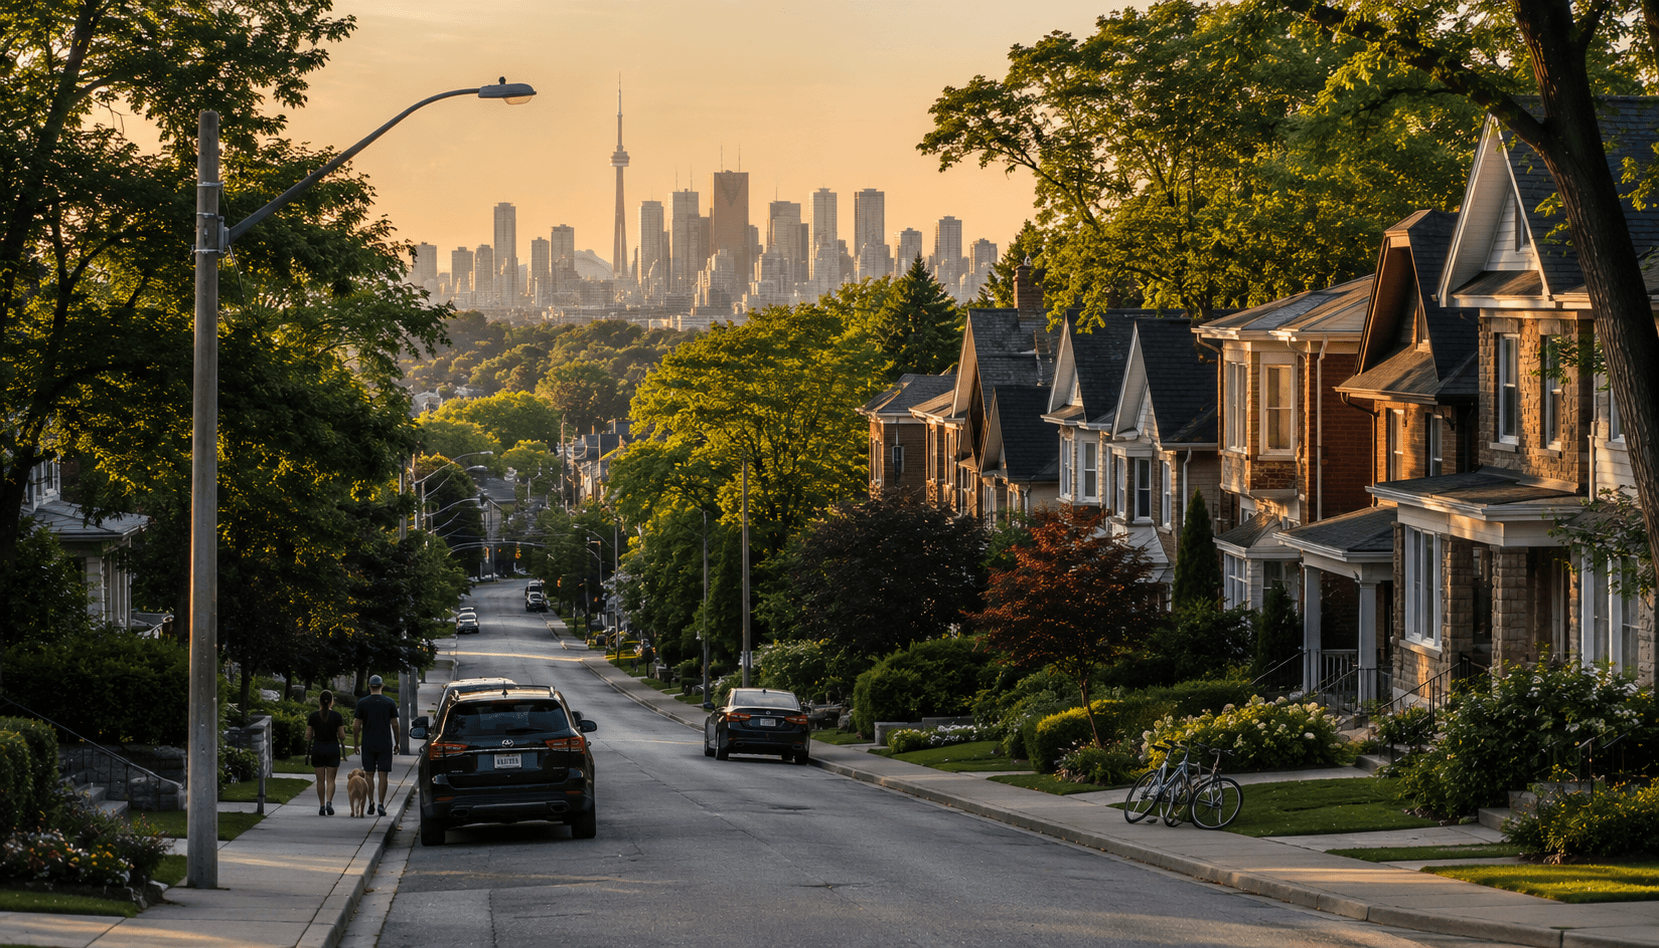
"Which Toronto neighbourhood is safest?" is one of the most common questions people ask before they move — and one of the hardest to answer from anecdotes alone. Facebook groups contradict each other. Headlines stick in memory even when the trend is flat. Realtors have incentives.
Safety Score ranks all 158 official Toronto Police neighbourhoods using the same open data behind the city's own crime statistics — no surveys, no opinion polls. Here is what that ranking looks like in 2026, based on published annual rates through 2025 plus live incident feeds on each neighbourhood page.
How the ranking works
Every neighbourhood gets a Safety Score from 1 to 100. Higher means less reported major crime relative to the typical Toronto neighbourhood:
| Score band | What it means |
|---|---|
| 85+ | Very low reported crime |
| 70 | Typical for Toronto |
| 55–69 | Around or below average |
| Below 40 | Among the busier parts of the city |
The score blends eight major crime categories — homicide, shooting, assault, robbery, break-and-enter, auto theft, bike theft, and theft over $5,000 — with heavier weight on violent offences. The full formula is public on our methodology page.
Three caveats before the tables:
- This measures reported major crime Toronto Police publish. It does not capture unreported crime, bylaw issues, or traffic safety.
- Annual scores use population-adjusted rates per 100,000 residents inside each official border — not raw incident counts alone.
- One unusual year can move small neighbourhoods on noise; the trend chart on each neighbourhood page shows whether a shift is sustained.
The 10 safest neighbourhoods
Highest Safety Scores in the city, using 2025 published rates:
| Rank | Neighbourhood | Safety Score |
|---|---|---|
| 1 | Lambton Baby Point | 98 |
| 2 | South Eglinton-Davisville | 97 |
| 3 | Forest Hill North | 97 |
| 4 | Avondale | 96 |
| 5 | Lawrence Park North | 96 |
| 6 | Steeles | 96 |
| 7 | Leaside-Bennington | 96 |
| 8 | Etobicoke West Mall | 96 |
| 9 | Lawrence Park South | 95 |
| 10 | Mount Pleasant East | 95 |
A few patterns stand out.
Midtown and north Toronto dominate the top: Lawrence Park, Leaside, Forest Hill North, and Mount Pleasant East are established residential pockets with a mix of detached homes and low-rise housing.
The west end has a quiet leader too. Lambton Baby Point, along the Humber near Baby Point, tops the entire city. It is small and mostly residential — worth checking the trend chart before treating 98 as permanent.
Safest does not mean zero crime. Even Lambton Baby Point sees reported incidents. The score means less than almost anywhere else in Toronto, not a guarantee.
The 10 lowest-scoring neighbourhoods
At the other end of the scale:
| Rank | Neighbourhood | Safety Score |
|---|---|---|
| 149 | Woodbine-Lumsden | 42 |
| 150 | Danforth | 41 |
| 151 | Wychwood | 40 |
| 152 | Mimico-Queensway | 37 |
| 153 | Yorkdale-Glen Park | 36 |
| 154 | West Humber-Clairville | 36 |
| 155 | Bendale-Glen Andrew | 35 |
| 156 | North Riverdale | 31 |
| 157 | University | 26 |
| 158 | Yonge-Bay Corridor | 16 |
The bottom of the list mixes downtown commercial cores with a handful of residential areas that still score well below the city median.
Yonge-Bay Corridor (score 16) covers the densest part of the entertainment district and waterfront strip. It behaves like a central business district in crime statistics — enormous foot traffic, nightlife, and transit hubs drive assault and robbery counts far above residential neighbourhoods.
University and North Riverdale are more lived-in but sit next to campus life and busy arterials respectively. Context matters when you compare a condo on a main street to a house on a side road inside the same statistical border.
West Humber-Clairville and Yorkdale-Glen Park show a different bottom-of-list story: high property crime, especially auto theft, in northwest pockets — the same pattern described in our auto theft analysis.
Where violent crime concentrates
Safety Score is not only about violence — property crime moves many rankings — but assault density separates downtown corridors from quiet residential streets. Published 2025 violent-crime rates (assault, robbery, shooting, and homicide combined, per 100,000 residents) cluster like this:
| Neighbourhood | Safety Score | Violent crime rate |
|---|---|---|
| Mimico-Queensway | 37 | 4,255 |
| Yonge-Bay Corridor | 16 | 3,685 |
| Downtown Yonge East | 49 | 2,516 |
| Moss Park | 44 | 2,400 |
| Kensington-Chinatown | 42 | 2,232 |
| University | 26 | 1,887 |
Mimico-Queensway's assault rate is an outlier driven partly by how incidents are geocoded inside a large, mixed-use border — another reason to search your exact address, not only the neighbourhood label.
What typical Toronto looks like
Most neighbourhoods are neither headline-safe nor headline-dangerous. Forty-eight of 158 sit between 55 and 75 on the Safety Score; the city median is 77.
If you are comparing two homes, a ten-point gap is meaningful — roughly a halving or doubling of the underlying crime index. A two-point gap is usually noise.
Useful side-by-side checks (all scores from the same 2025 data):
| Comparison | Score A | Score B |
|---|---|---|
| Blake-Jones vs The Beaches | 81 | 93 |
| Scarborough Village vs Agincourt South-Malvern West | 53 | 46 |
| Fort York-Liberty Village vs Harbourfront-CityPlace | 68 | 65 |
Each neighbourhood page includes a multi-year chart back to 2014 so you can see whether a score is improving or slipping.
Common misunderstandings
Affluent does not always mean safe. Rosedale-Moore Park scores 68 — below typical Toronto — with published break-and-enter and auto theft rates of 456 and 200 per 100,000 residents in 2025. Organized vehicle theft targeting luxury driveways shows up in wealthy borders too.
Scarborough is not one thing. The east end contains dozens of separate neighbourhoods with scores from the 40s to the 90s. Always check the specific border, not the borough name.
One bad incident does not define a year. Safety Scores use annual rates. A shooting can traumatize a community without moving a year-long average much — and a quiet year does not erase history. Read the trend.
Rankings do not replace street-level research. Two houses on the same block can face different risk — corner vs mid-block, lane vs park. Use the address search for the exact property, not just the neighbourhood average.
Annual scores vs what is happening now
Annual scores depend on Toronto Police publishing full neighbourhood rate tables, so they lag by months. For recent activity, neighbourhood pages and the crime map also show 30-day and 90-day incident counts from the live year-to-date feed.
A neighbourhood can rank highly on the annual score while showing a short spurt of break-ins this month — or rank poorly overall while improving over five years. Check both the score and the recent table.
How to use this ranking
If you are buying a home: search the exact address on the crime map, open the neighbourhood page for context, and filter the 12-month table to break-and-enter and auto theft if you are purchasing a detached with a driveway.
If you are comparing rentals or condos: narrow the radius to 250 m on the explore page to approximate your building's immediate pocket, not the whole neighbourhood border.
If you live in Toronto now: set a free email alert for your address to catch new reports within 500 m without checking back weekly.
The bottom line
Toronto in 2026 is not one crime story. Downtown cores struggle with assault and robbery density. Northwest pockets see auto theft spikes. Affluent midtown streets can still be targeted for property crime. The quietest statistical neighbourhoods — Lambton Baby Point, Lawrence Park, Forest Hill North — genuinely see less reported major crime than the city median.
The lowest scores belong disproportionately to commercial and entertainment zones, but several residential areas in the 30s and 40s deserve attention if you are price-shopping across the city.
The ranking is a starting point, not a verdict. One dataset, 158 neighbourhoods, every address searchable — explore the complete map, sort the home page rankings, or open any neighbourhood from the tables above.
Scores calculated from Toronto Police Service neighbourhood crime rates and Major Crime Indicators, annual data through 2025, live feeds refreshed daily. See about our data and methodology. Safety Score is independent analysis, not affiliated with Toronto Police.